Posts tagged Data Visualization
Chicago Fall Colors in Context: Using GHCNd Data!
- 03 November 2022
Tonight, Ben Blaiszik (@BenBlaiszik) mentioned the following:

Visualizing Hurricane Ian Using hvPlot
- 27 September 2022
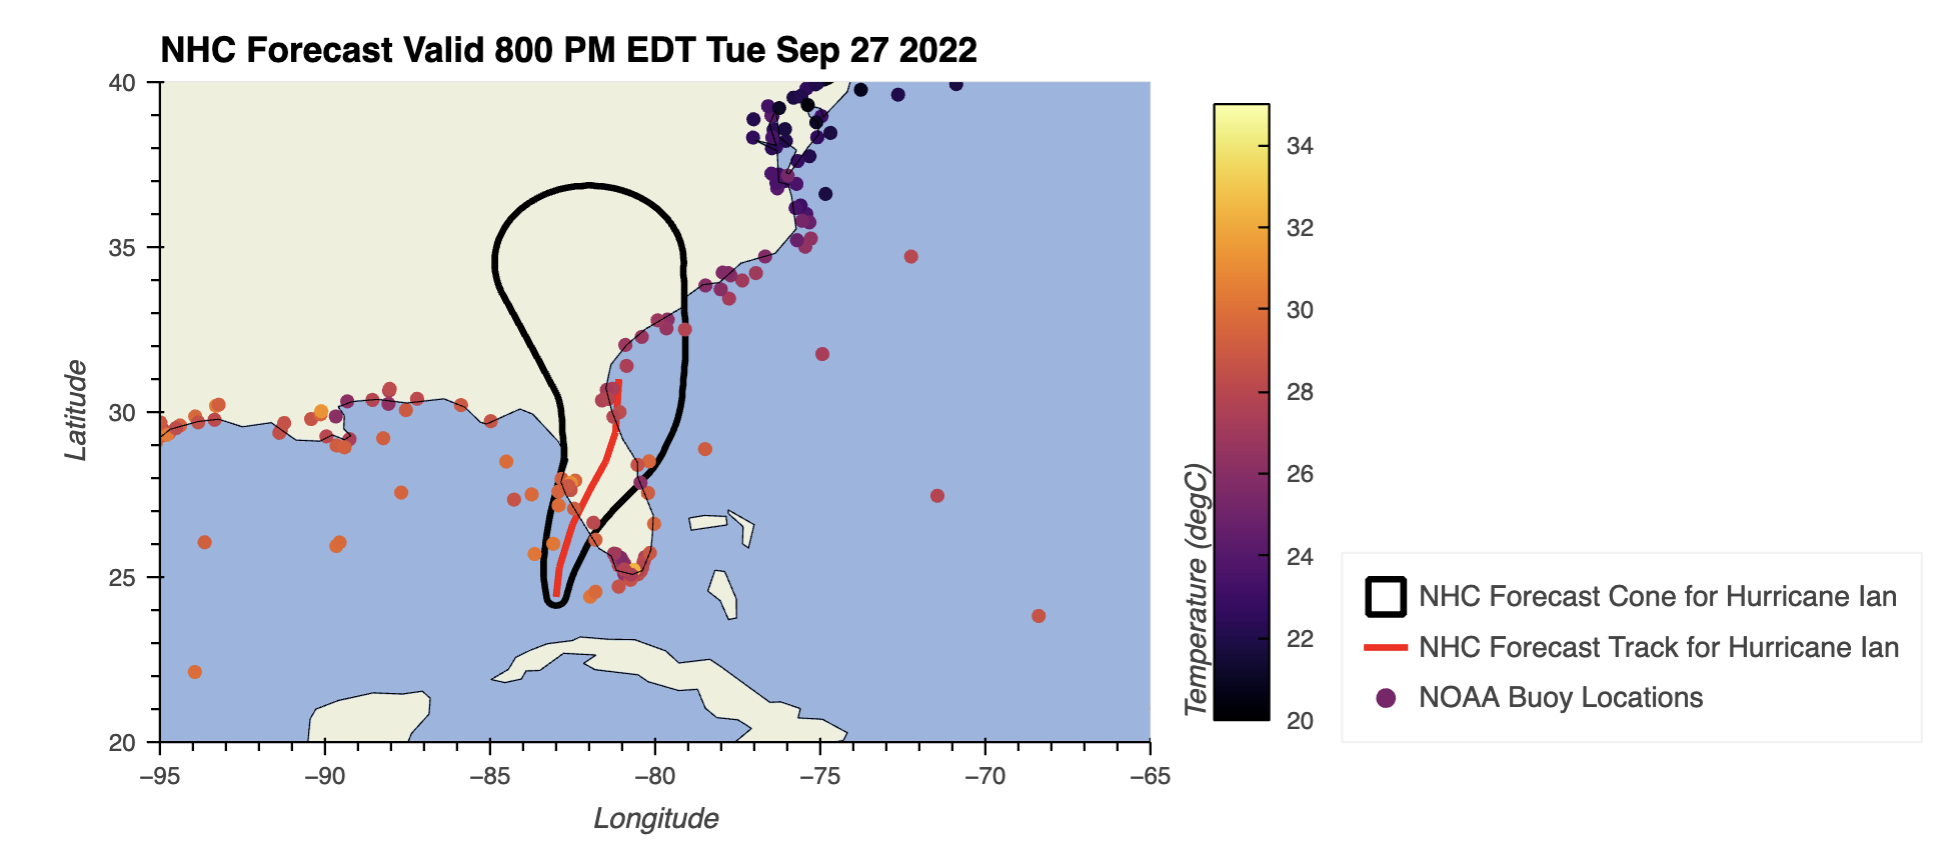
Within this post, we explore how we can use hvPlot to plot data from Hurricane Ian, which will soon make landfall in Florida.
By the end of this post, you will be able to recreate the following plot:
